Sea Ice retreat
Here we are - I found the maps I was after.
You can see how much the sea ice has retreated off the coasts of Alaska and Siberia in comparison to the expected mean - that's the fat pink line around the edge.
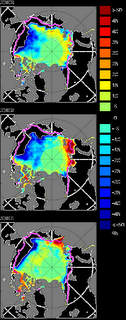
Sea ice conditions for September 2002, 2003, and 2004, derived from the Sea Ice Index. Each image shows the concentration anomaly (key on right) and the 1979-2000 median September ice edge (pink line). For each year, the ice edge is well north of its median position off the coasts of Alaska and Siberia. Image provided by National Snow and Ice Data Center, University of Colorado, Boulder.
This is all from this really cool website http://www.nsidc.org/sotc/sea_ice.html
here's an extract...
Passive microwave satellite data reveal that Arctic ice extent decreased about 3 percent per decade while Antarctic ice extent increased by 0.8 percent per decade (Cavalieri et al. 2003).
In recent years, satellite data have indicated an even more dramatic reduction in regional ice cover. In September 2002, sea ice in the Arctic reached a record minimum (Serreze et al. 2003), 4 percent lower than any previous September since 1978, and 14 percent lower than the 1978-2000 mean.
Fossil fuel consumption and the resulting increase in global temperatures could explain sea ice decline, but the actual cause might be more complicated. The Arctic Oscillation (AO) is a seesaw pattern of alternating atmospheric pressure at polar and mid-latitudes. So sea ice decline may result from natural variability in the AO. Growing evidence suggests, however, that greenhouse warming favors the AO's positive mode, meaning recent sea ice decline results from a combination of natural variability and global warming.
You can see how much the sea ice has retreated off the coasts of Alaska and Siberia in comparison to the expected mean - that's the fat pink line around the edge.

Sea ice conditions for September 2002, 2003, and 2004, derived from the Sea Ice Index. Each image shows the concentration anomaly (key on right) and the 1979-2000 median September ice edge (pink line). For each year, the ice edge is well north of its median position off the coasts of Alaska and Siberia. Image provided by National Snow and Ice Data Center, University of Colorado, Boulder.
This is all from this really cool website http://www.nsidc.org/sotc/sea_ice.html
here's an extract...
Passive microwave satellite data reveal that Arctic ice extent decreased about 3 percent per decade while Antarctic ice extent increased by 0.8 percent per decade (Cavalieri et al. 2003).
In recent years, satellite data have indicated an even more dramatic reduction in regional ice cover. In September 2002, sea ice in the Arctic reached a record minimum (Serreze et al. 2003), 4 percent lower than any previous September since 1978, and 14 percent lower than the 1978-2000 mean.
Fossil fuel consumption and the resulting increase in global temperatures could explain sea ice decline, but the actual cause might be more complicated. The Arctic Oscillation (AO) is a seesaw pattern of alternating atmospheric pressure at polar and mid-latitudes. So sea ice decline may result from natural variability in the AO. Growing evidence suggests, however, that greenhouse warming favors the AO's positive mode, meaning recent sea ice decline results from a combination of natural variability and global warming.


